
")
Story of a recent storm in the Baleares that damaged many boats
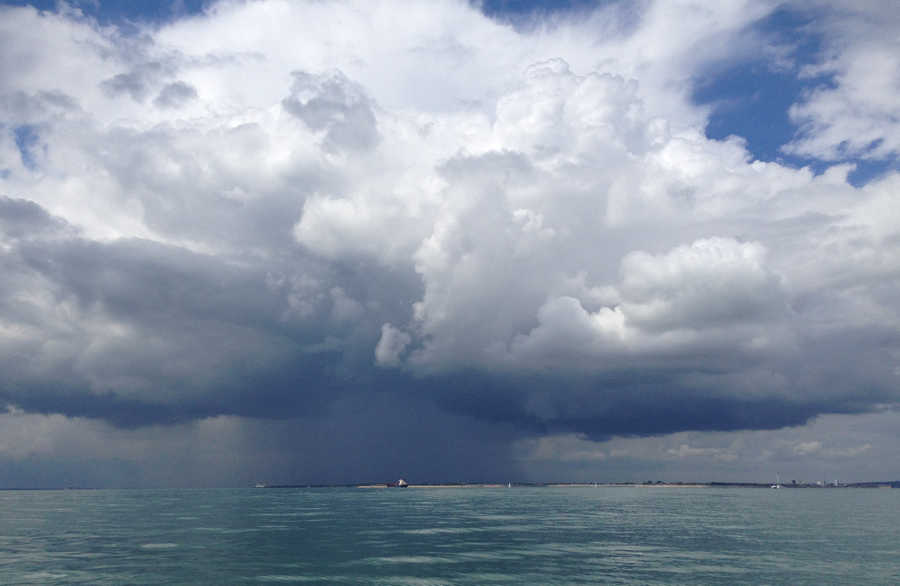
On the night of 9-10 August 2017 Formenera and Ibiza were hit by a severe convective storm that was "unexpected" by most skippers in the area who did not secure their boats accordingly. The result was severe damage to many craft. The following link wil bring up a presentation and discussion on this particular storm.
What does openWRF provide to forecast thunderstorms and convective systems
openWRF forecasts include two variables to help forecast thunderstorm activity and subsequent squalls:
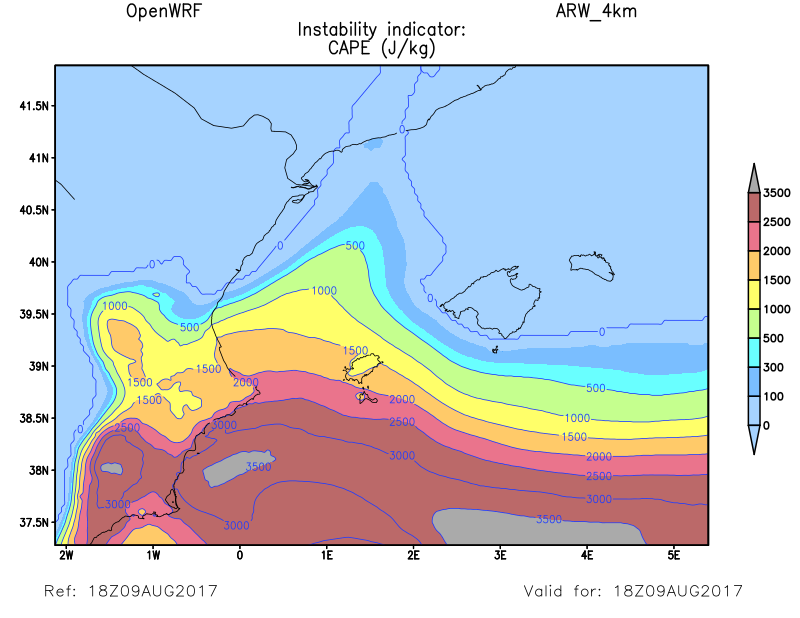
- CAPE (Convective Available Potential Energy) which is measured in Jouls per Kg. This indicate the amount of energy available for convection (the upward movement of air which is a major process in the creation of stormy weather). A larger value of CAPE indicates the possibility of faster and more violent convection updrafts. CAPE itself only indicates the potential for convection and not that convection has actually been triggered.
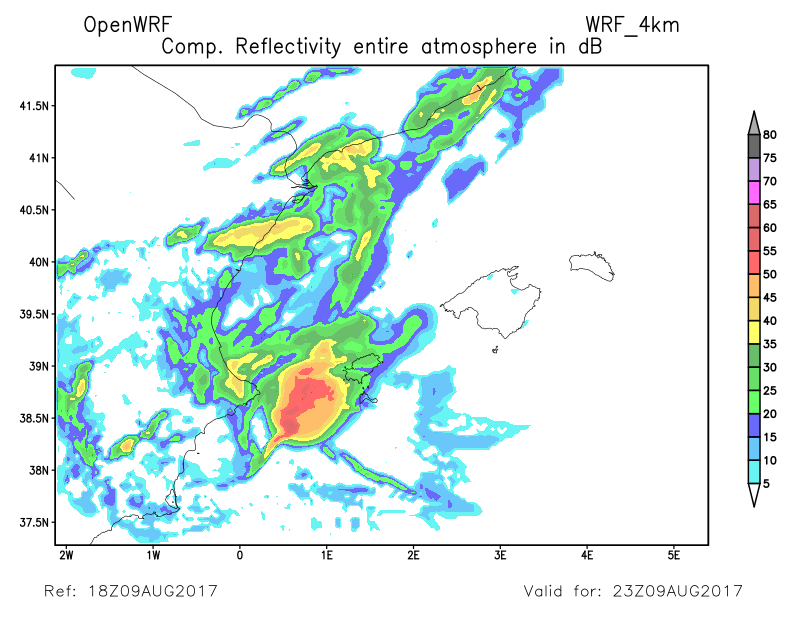
- Simulated Composite RADAR Reflectivity (Reflectivity for short). This variable forecasts what a weather radar may be showing considering the amount of water forecast to be in the atmosphere. The varible is in units of dBZ. The advantage of this Reflectivity variable is that it is also a fairly good indicator of convection that is forecast to be triggered and the subsequent development of thunderstoms. Values above 40-45 dBZ indicate hail and can be associated with thunderstorms.
Where do I find these thunderstorm indicators?
Go to "Charts" in the main menu then select the model covering your area of interest. Following that, in the forecast variables, first select "Instablility Index CAPE" and then "Simulated weather & storm Radar".
Both variables are also shown in the meteogram for a specific location using "Wind & Waves" in the main menu. To better understand the area probability of thunderstorms it is recommended to first check the "Charts" section before focusing on a point in "Wind & Waves"
What do the numbers tell me?
CAPE is a measure of instability. However, instablility on it's own is not enough to ensure thunderstorms. There needs to be a lifting factor due to orography or frontal activity. Check for other hints such as high humidity and a forecast of showers in the area.
Critical Values of CAPE
Less than 300 : little or no convective potential
300 to 1000 : weak convective potential
1000 to 2500 : moderate to strong convective potential
Above 2500 : very strong convective potential
REFLECTIVITY is a measure of the amount of water/hail in the atmosphere and also and indicator of its velocity (vertical) in the case of Doppler weather Radars.
Critical Values of Reflectivity
Less than 40 dBZ: mainly and indication of the amount of precipitation to be expected
40 to 50 dBZ: Thunderstorms are probable
Above 50 dBZ: Thunderstorms
A large area with high reflectivity or lines with high values indicate complexes of squalls or lines of squalls.
Sample Charts
The following examples are related to severe squalls in Formentera on 9-10 Aug 17. The first chart displays values of CAPE and it shows extreme instability in the Western Mediterranean near Ibiza at 18Z. CAPE values increase SW of Ibiza and Formentera.
The next sample chart displays the forecast for simulated Radar Reflectivity. It shows a huge supercell storm that developed 5 hours later and, according to the forecast, is about to hit Formentera and Ibiza's west coasts. More lines of forecast thunderstorms (values above 40-45) can be seen NW of the Baleares on the Spanish coast.